Understanding of 3 types of motion-time graphs is important, because they provide the information, and the ways to interpret different aspects of motion.
Table of Contents
Introduction
Motion is a fundamental concept in physics, describing how objects move over time. To visualise and analyse this movement, motion–time graphs are essential tools.
These graphs allow us to understand the relationship between motion parameters (like displacement, velocity, and acceleration) and time, providing insight into how an object behaves as it moves.
What is a Motion–Time Graph?
It is defined as,
“graphical representations that show how a physical quantity (such as distance, velocity, or acceleration) changes with time.”
3 Types of Motion-Time Graphs
There are three motion vs time graphs and these include,
- Displacement–Time (d–t) Graph
- Velocity–Time (v–t) Graph
- Acceleration–Time (a–t) Graph

These graphs provide a clear and detailed visual framework to analyse the motion of an object. They make it easier to understand concepts like state of rest, uniform motion, and non-uniform motion. They can take several forms, each corresponding to a specific quantity being plotted against time.
Here, it is important note that displacement, velocity, and acceleration are vector, whereas both distance and speed are scalar.
What Do Motion–Time Graphs Entail?
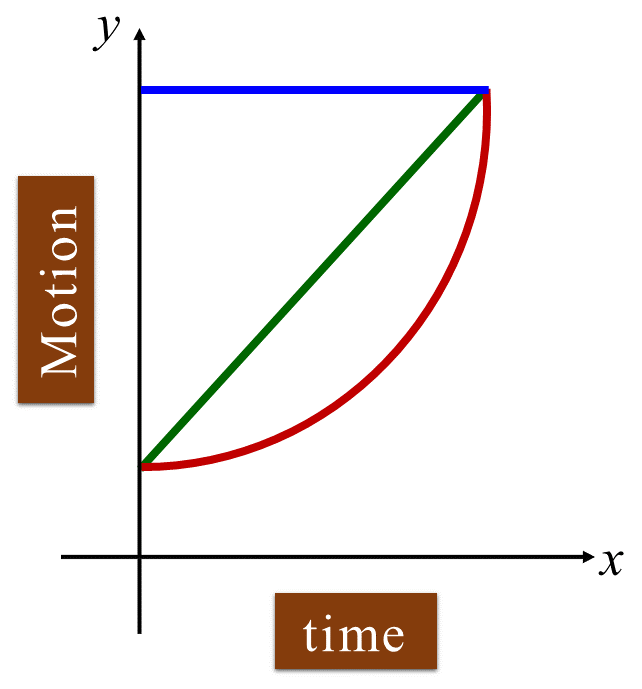
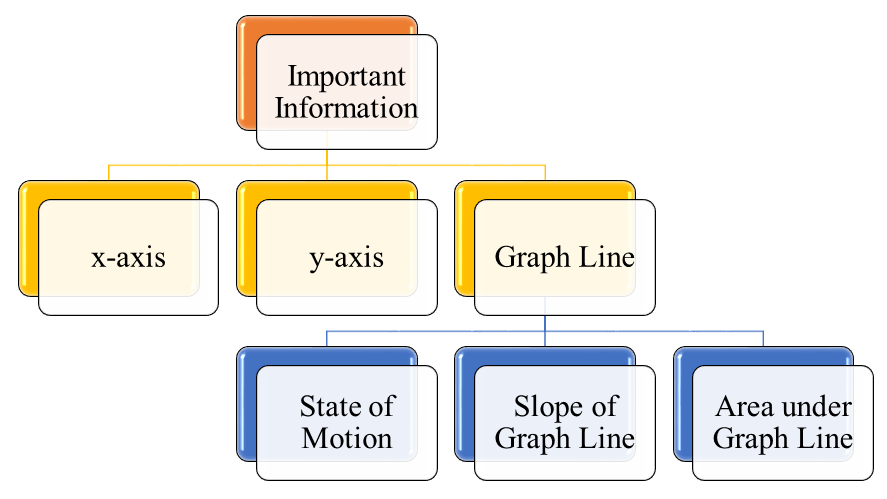
A motion-time graph typically involves three things.
- x-axis (represents time)
- y-axis (represents the quantity of motion–displacement, velocity, or acceleration)
- Graph Line (can be horizontal, inclined, or curved, offers important information about motion)
What Information Do Motion-Time Graphs Provide?
Motion–time graphs provide critical insights into the movement of objects.
x-axis
Provides the time of the journey.
y-axis
- For a displacement–time graph, it shows displacement (or distance).
- For a velocity–time graph, it shows velocity (or speed).
- For an acceleration–time graph, it shows acceleration.
Graph Line
The graph line provides three key pieces of information.
State of Motion
d–t Graph
From the d–t graph, we get the following information (as shown).

What We Learnt?
The graph includes two regions, one above x-axis (forward motion) and one below x-axis (reverse motion). It shows, at first, the object is at rest, followed by uniform motion, and then transitioning into non–uniform motion.
The graph uses time on the horizontal axis and displacement on the vertical axis, indicating how position of an object changes over time in various motion states.
v–t Graph
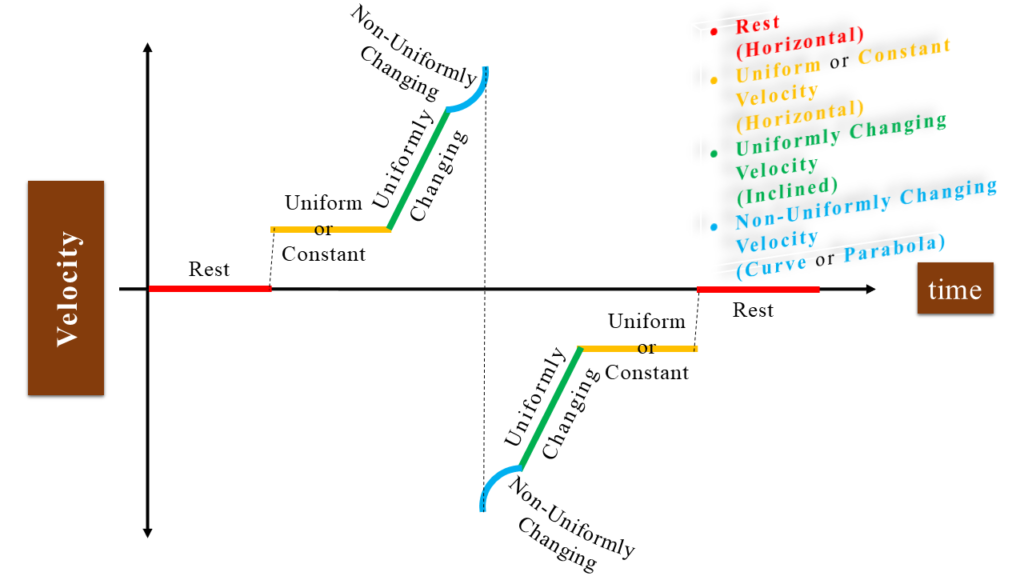
What We Learnt?
The graph uses time on the horizontal axis and velocity on the vertical axis, showing how the velocity of an object changes over time through periods of rest, constant velocity, and both uniformly and non-uniformly changes in velocity (also called as variable velocity).
The graph also includes two regions, one above x-axis and one below x-axis, showing forward and reverse motions respectively.
a–t Graph
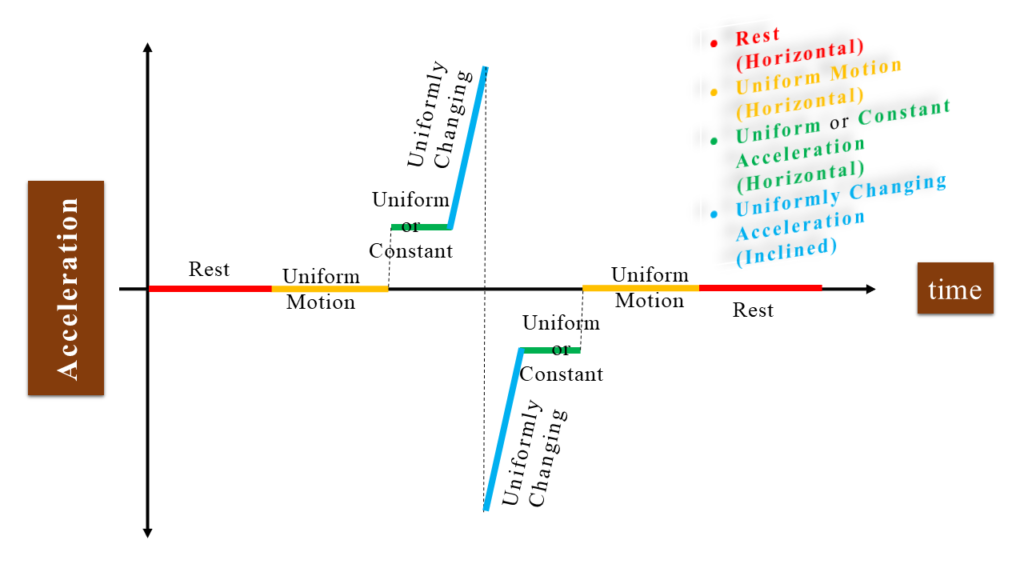
What We Learnt?
The graph has time on the horizontal axis and acceleration on the vertical axis, depicting how acceleration changes with time through periods of rest, constant velocity (uniform motion–meaning no acceleration), constant acceleration, and changing acceleration.
The a–t graph can also include a region above x-axis and a region below x-axis, showing forward and reverse motions respectively.
Slope of the Graph Line
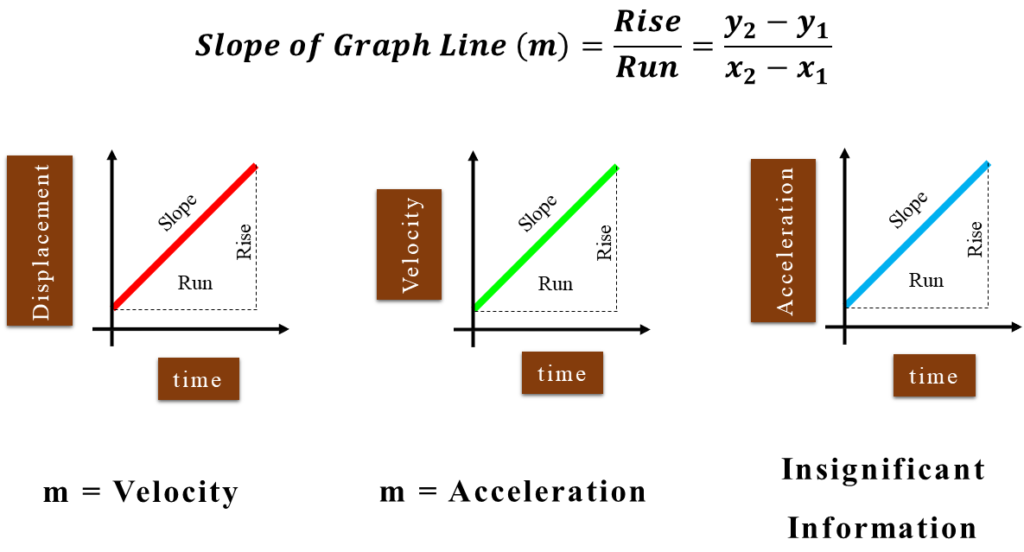
What We Learnt?
- For a displacement–time graph, the slope equals velocity (or speed).
- For a velocity–time graph, the slope indicates acceleration.
- For an acceleration–time graph, the slope does not convey as much useful information, as it shows how acceleration changes over time, which is often less relevant.
Area under the Graph Line
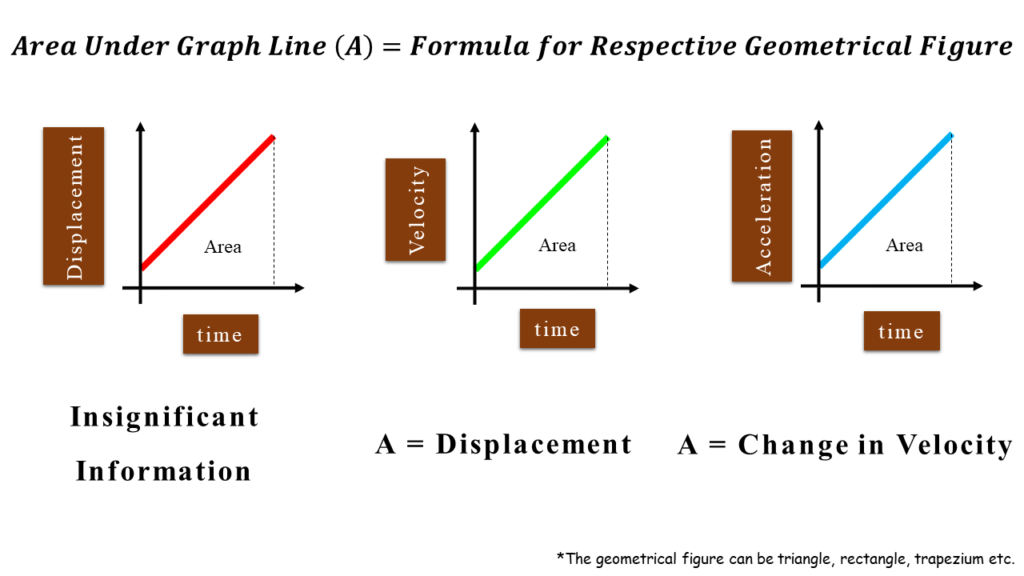
What We Learnt?
- In a displacement–time graph, this area does not provide any vital information (just shows the change in position).
- In a velocity–time graph, it gives the total displacement (or distance) covered.
- In an acceleration–time graph, it indicates the change in velocity, which is typically not of great interest.
Conclusion
Motion-time graphs are simple yet powerful tools. They help us understand how things move. In a nut shell, they turn the idea of motion into easy-to-see pictures. It shows us how objects change their position, speed, or acceleration over time.
By learning to read and use these graphs, we can better understand the basics of motion, making it easier to study physics and apply it to real-life situations, like how cars move or how things fall to the ground.
Motion vs time graphs allow us to gain a deeper insight into the mechanics of motion by preparing us with the foundational concepts essential in physics and engineering.
Frequently Asked Questions (FAQs)
What is a motion–time graph in physics?
A motion–time graph is a type of graph that shows how a physical quantity like displacement, velocity, or acceleration changes over time. These graphs help us visually understand how objects move.
How do you interpret a displacement–time graph?
In a displacement–time graph, the slope of the line shows the velocity of the object. A flat line means the object is at rest, while an upward slope means it is moving forward, and a downward slope shows it is moving backward.
What is the difference between displacement–time and velocity–time graphs?
A displacement–time graph shows how position of an object changes over time, while a velocity–time graph shows how its speed or velocity changes over time. The slope of a displacement–time graph gives velocity, while the slope of a velocity–time graph gives acceleration.
How can you find velocity from a displacement–time graph?
We can find velocity by calculating the slope of the displacement–time graph. A steeper slope means a higher velocity, while a flat slope means the object is not moving.
What does the area under a velocity–time graph represent?
The area under a velocity–time graph represents the total displacement (or distance) the object has travelled. It gives the amount of space covered during the time shown on the graph.
How do acceleration–time graphs differ from velocity–time graphs?
An acceleration–time graph shows how acceleration of an object changes over time, while a velocity-time graph shows how its velocity changes. The slope of the acceleration–time graph does not carry much meaning but the area under the curve can show velocity change.
What is the significance of the slope in motion–time graphs?
In motion-time graphs, the slope carries important information. In displacement–time graphs, it shows velocity; in velocity–time graphs, it shows acceleration. A steeper slope means faster movement or quicker acceleration.
What can be learned from an acceleration–time graph?
An acceleration–time graph helps us see how acceleration of an object changes. If the line is flat, the object has constant acceleration. If it is sloped, acceleration is changing, but it is less commonly analysed compared to the other graphs.
How does a motion–time graph help in understanding motion?
Motion–time graphs give a clear picture of how objects move, whether they are speeding up, slowing down, or staying at rest. They help simplify the study of motion and make it easier to predict future movement.
Why is it important to learn motion–time graphs?
Learning motion–time graphs is essential because they help students understand the basics of motion, a key part of many physics topics. These graphs provide a foundation for more advanced studies and real-life applications.
