
Here you will learn about plotting graphs with real values. It continues our previous discussion on plotting graphs.
Table of Contents
Introduction
This part of your learning journey is all about going beyond the simple stuff. Earlier, you worked with graphs that use whole numbers. These graphs were included:
1. Category vs Number Graphs (The Friendly Start)
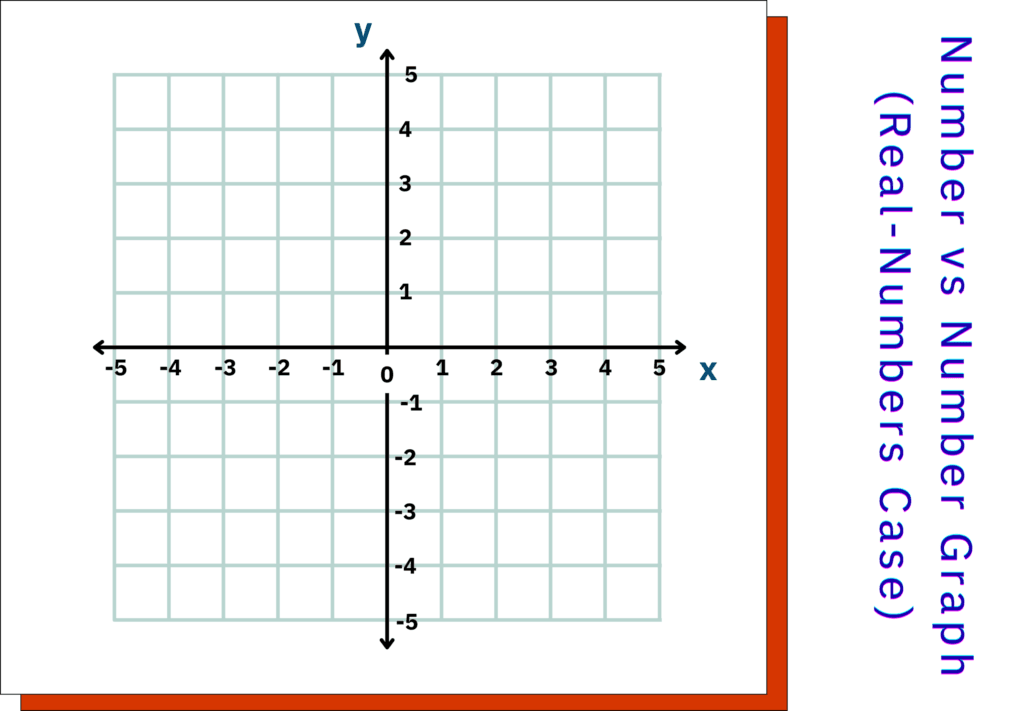
2. Number vs Number Graphs (Whole Number Case)
But what happens when real values have unequal steps or lie far from the origin? That is where Stage 3 comes in!
Stage 3: Real Number vs Real Number Graphs (Advanced or Real-World Data)
What is a Graph?
Earlier, you saw, a graph is a picture of your data. It is a way to show how a change in one variable influences the change in another variable. A good graph does not just show numbers — it helps us to understand changes over time.
A graph is a pictorial representation of data.
Stage 3 | Real Number vs Real Number Graphs
Now look at the advanced or real-world data graphs where the numbers do not follow even steps. The numbers may:
- include decimals
- have irregular intervals
- present far away from the origin
When working by hand on graph paper, you must choose axis intervals that are compatible with the markings. That means:
- Pick scales that divide evenly into the total range.
- Pick clean and friendly values like 0.5, 1, 2, 5, or 10 per big box, so each small box may represent a nice decimal (like 0.1, 0.2, 0.25, etc.).
Why is it important?
- Develops analytical skills
- Reflects a real-data scenario
- Teaches to interpret and adjust ranges
- Enables fluency in scaling and graphing
How to Do It?
For a case like this, there are 2 main issues.
i. Real values with unequal intervals (like 1.9, 5.1, 9.1, etc.).
ii. Numbers far apart from origin (like 99, 175, 200.5, etc.)
To draw a graph like this, take a few important steps first.
- Scaling along the axes with friendly intervals of real values. It is mostly based on your interaction with graphs; however, there is a basic learner’s estimation process.
- The other important step is to break the axes. You can think of it as skipping part of the graph. It is done by adding a zigzag or squiggle (//) at the beginning of the axes.
This helps:
- Save space
- Make the graph easier to read
- Focus on the useful part of the data
Both steps are discussed below with an example.
Note
You can also start from 0; however, it is helpful when you want:
- a true zero baseline for comparisons
- to emphasise how far the values are from the rest
But it does compress your data, so be sure your scale still makes the graph readable and accurate.
How to Draw?
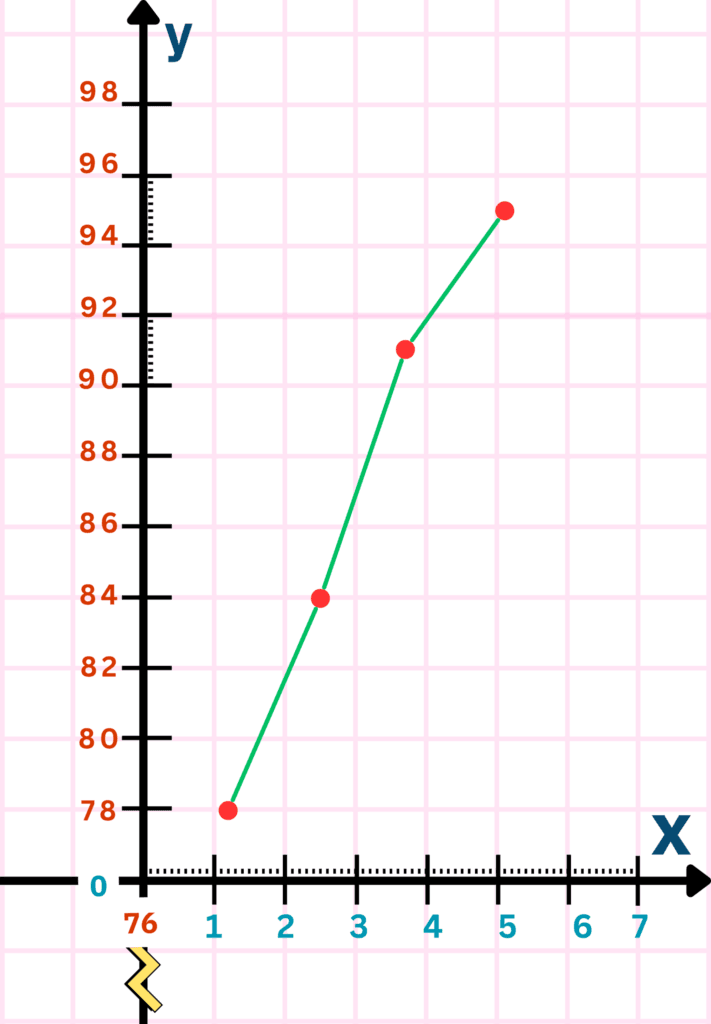
Below is a set of real-world data (time vs heart rate).
| Time (min) | Heart Rate (bpm) |
|---|---|
| 1.2 | 78 |
| 2.5 | 84 |
| 3.7 | 91 |
| 5.1 | 95 |
Before proceeding further, the main task is to define the scale along both axes.
Along the x-axis (Normal Scaling)
Minimum Value = 1.2
Maximum Value = 5.1
Range = Maximum Value – Minimum Value + 1
Total Big Boxes (BB) = 8
Interval = Range/BB
Interval = 4.9/8 = 0.61
Range = 5.1 – 1.2 + 1 = 4.9
Closest Friendly Value Corresponding to 0.61 for 8 BB = 1 min
If you take 0.5 as the closest friendly value, the final value will fall outside the available range. However, for the closest friendly value of 1, data points lie within the available space.
Hence,
1 BB = 1 min
10 Small Boxes (SB) = 1 BB
10 SB = 1 min
1 SB = 1/10 min = 0.1 min
Make sure you can mark each data point accurately.
Along the y-axis (Breaking Axis)
Minimum Value = 78
Maximum Value = 95
Since there is a large gap between the origin (0) and the starting value (78), add a zigzag or squiggle (//) at the bottom of the y-axis. Now, the y-axis starts closer to the data (70 or 75).
Range = Maximum Value – Minimum Value + 1
Range = 95 – 78 + 1 = 18
Total Big Boxes (BB) = 13
Interval = Range/BB
Interval = 18/13 = 1.3
Closest Friendly Value Corresponding to 1.3 for 13 boxes = 2 bpm
Hence,
1 BB = 2 bpm
10 Small Boxes (SB) = 1 BB
10 SB = 2 bpm
1SB = 1/10 min = 0.2 bpm
You can also continue scaling either from 70 or 75 with 1 BB = 5 bpm (e.g., 70, 75, 80 …).
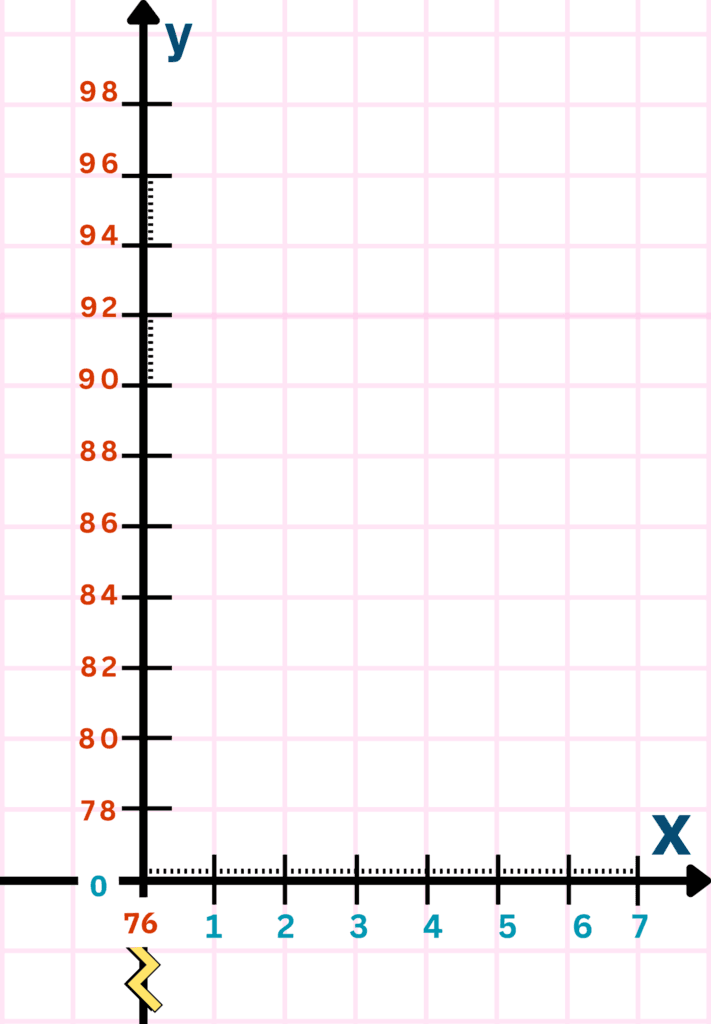
Drawing the Graph
- Draw a coordinate system (only 1st quadrant).
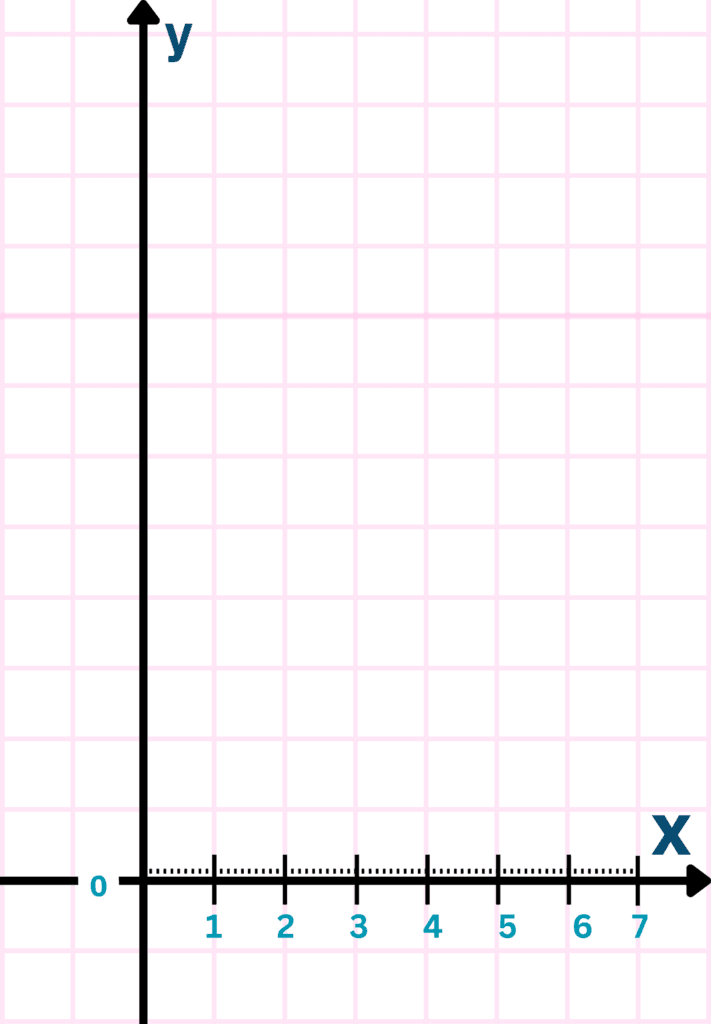
- Mark evenly spaced x-axis representing time (e.g., 1 BB = 1 min & 1 SB = 0.1 min).
- Mark evenly spaced y-axis representing heart rate (e.g., 1 BB = 2 bpm & 1 SB = 0.2 bpm).
- Locate the data points on the x-axis.

- Locate the data points on the y-axis.
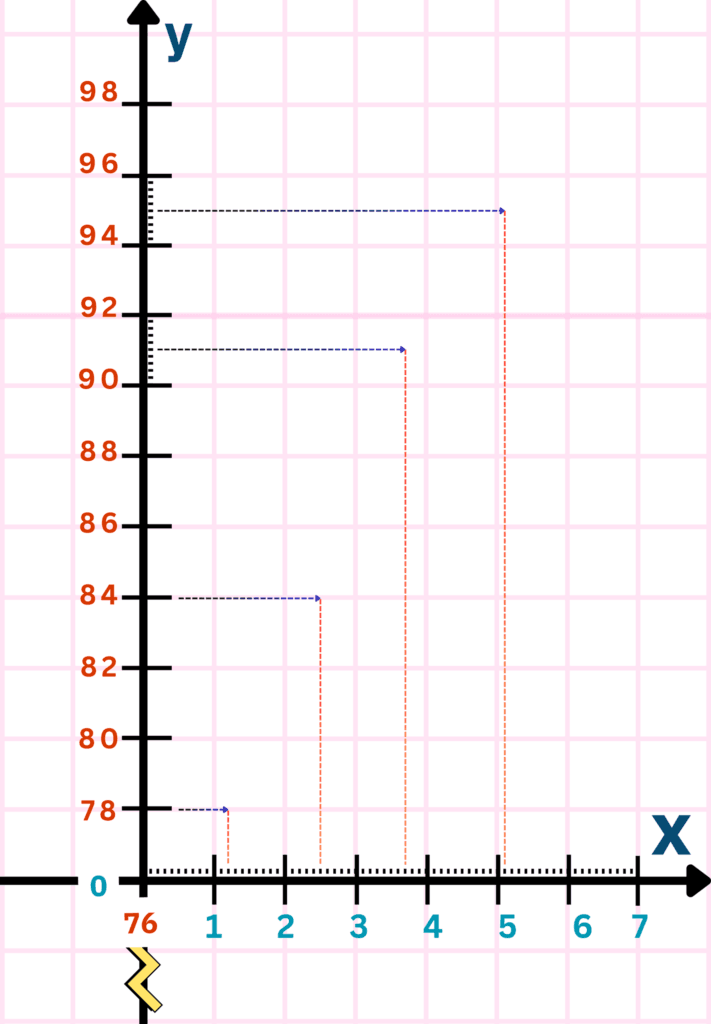
- Plot data points on the graph (the intersection point of a parallel horizontal line and a parallel vertical line).
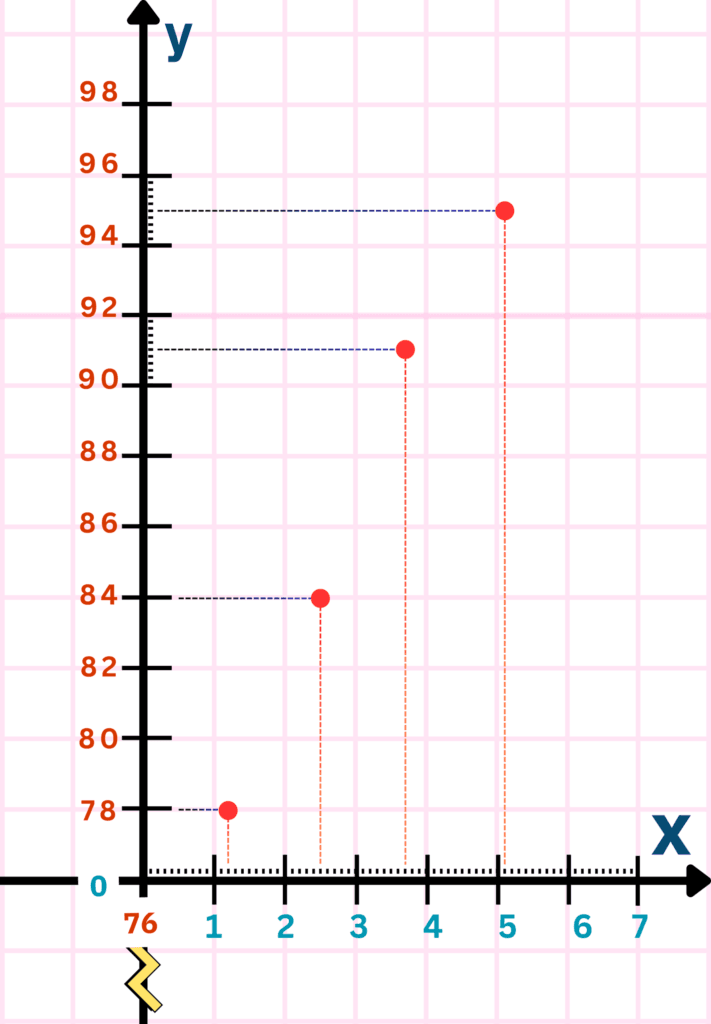
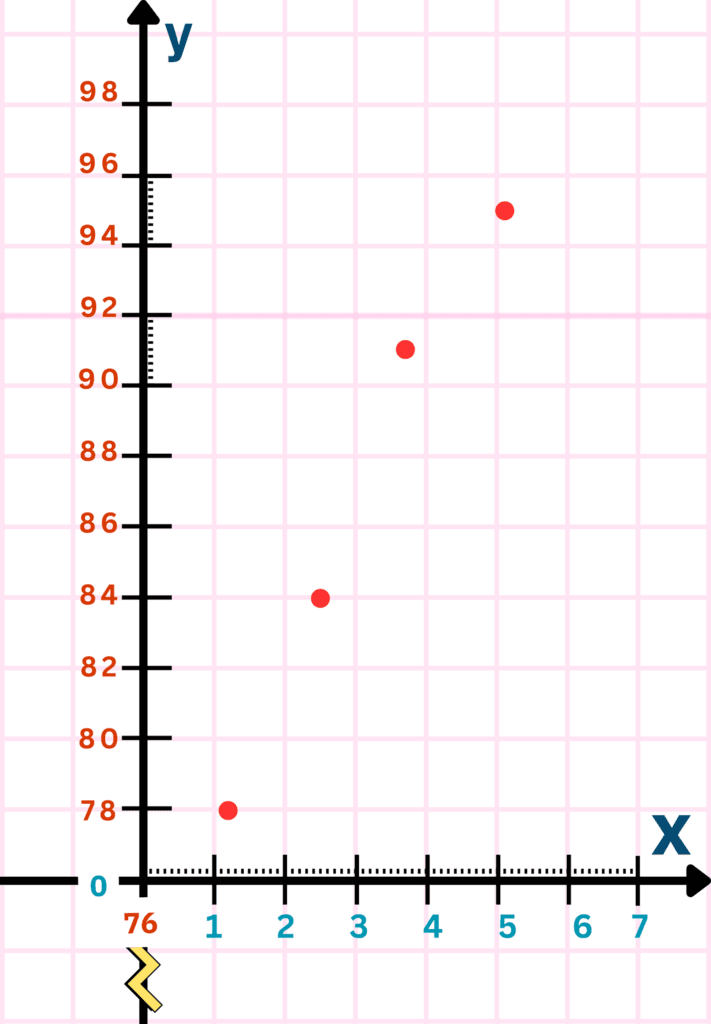
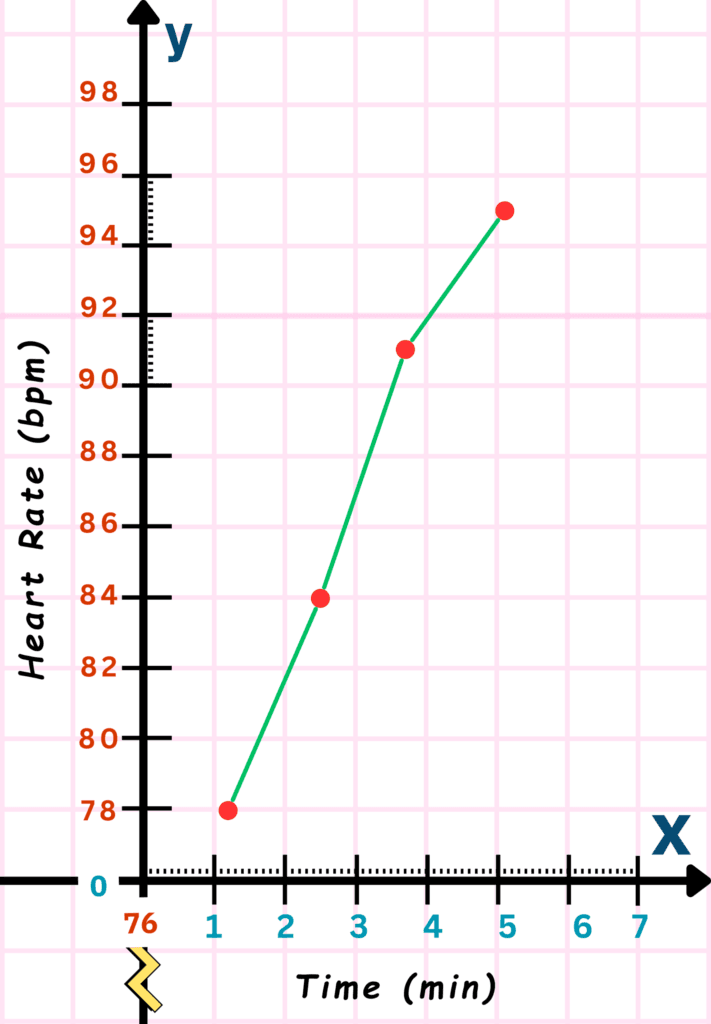
The cleaner version of this graph looks like this:
- Connect points to draw a line graph.
- Label graph elements: graph title, axes titles, legends (if any), etc.
Conclusion
Plotting graphs with real values helps you move beyond basic number skills and into real-world data understanding.
In this stage, you learned how to choose smart intervals and use techniques like axis breaks to make your graphs neat, readable, and accurate. Even when the numbers are not whole or near zero, you can still make a graph with ease.
From choosing friendly scales to plotting real-time data, you have seen how graphs can reveal patterns in complex data.
Keep practicing to strengthen your ability to understand the world through data!
Frequently Asked Questions (FAQs)
How is plotting graphs with real values different than those with whole numbers?
| Feature | Whole Numbers Graphs | Real Values Graphs |
| Type of Numbers | Whole numbers (e.g., 1, 2, 3) | Real numbers including decimals (e.g., 1.2, 3.7, 99.5) |
| Interval Spacing | Even and regular (e.g., 1 unit per big box) | Irregular or decimal-based intervals (e.g., 0.5, 1.3, etc.) |
| Scaling Complexity | Simple, straightforward | Requires careful choice of friendly intervals |
| Axis Starting Point | Usually starts from 0 | May start far from 0; axis break (//) often used |
| Use of Decimals | Rare or unnecessary | Common and necessary for accuracy |
| Graph Layout | Clean and easy to plot | Needs more planning to avoid clutter |
| Real-World Use | Basic, good for early learning | Reflects real-world data (e.g., time, temperature, rates) |
| Skills Developed | Counting, reading simple data | Estimation, scaling, and data interpretation |
Why do we use axis breaks (zigzags)?
Axis breaks help skip large gaps from zero and focus on the data range, saving space.
What is a friendly scale in graphing?
A friendly scale uses easy-to-read numbers like 0.5, 1, 2, or 5 to keep the graph simple.
Can I start my graph from zero?
Yes!
But only if it does not squeeze your data too much. Use it when showing total comparisons.
Why are these graphs important?
They help you understand real-life data better and build critical thinking in math and science.